Page 30 - IP Record
P. 30
28 The IP Record - 2014
USPTO Data
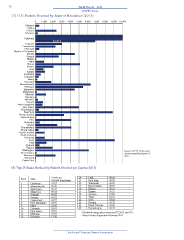
17) U.S. Patents Granted by State of Residence (2013)
0 1,000 2,000 3,000 4,000 5,000 6,000 7,000 8,000 9,000 10,000
Alabama
Alaska
Arizona
Arkansas
California
36,814
Colorado
Connecticut
Delaware
District of Columbia
Florida
Georgia
Hawaii
Idaho
Illinois
Indiana
Iowa
Kansas
Kentucky
Louisiana
Maine
Maryland
Massachusetts
Michigan
Minnesota
Mississippi
Missouri
Montana
Nebraska
Nevada
New Hampshire
New Jersey
New Mexico
New York
North Carolina
North Dakota
Ohio
Oklahoma
Oregon
Pennsylvania
Rhode Island
South Carolina
South Dakota
Tennessee
Texas
Utah
Vermont
Virginia
Washington Source: USPTO Performance
West Virginia and Accountability Report FY
Wisconsin 2013
Wyoming
Puerto Rico
18) Top 25 States Ranked by Patents Granted per Capita (2013)
Patents per 14 Utah 49.41
Rank State
100,000 Inhabitants 15 New York 45.28
1 California 97.67 16 Wisconsin 41.21
2 Massachusetts 96.38 17 Rhode Island 40.05
3 Washington 90.32 18 Illinois 39.61
4 Minnesota 85.24 19 Kansas 37.51
5 Vermont 80.62 20 Arizona 37.08
6 Oregon 66.01 21 Texas 36.18
7 Connecticut 64.57 22 Ohio 35.65
8 New Hampshire 62.59 23 Nevada 34.37
9 Idaho 61.07 24 North Carolina 33.68
10 Colorado 58.67 25 Pennsylvania 32.44
11 New Jersey 55.81
12 Michigan 54.93 Calculated using patent counts for FY 2013 and U.S.
13 Delaware 51.70 Census Bureau Population Estimates 2013
Intellectual Property Owners Association
USPTO Data
17) U.S. Patents Granted by State of Residence (2013)
0 1,000 2,000 3,000 4,000 5,000 6,000 7,000 8,000 9,000 10,000
Alabama
Alaska
Arizona
Arkansas
California
36,814
Colorado
Connecticut
Delaware
District of Columbia
Florida
Georgia
Hawaii
Idaho
Illinois
Indiana
Iowa
Kansas
Kentucky
Louisiana
Maine
Maryland
Massachusetts
Michigan
Minnesota
Mississippi
Missouri
Montana
Nebraska
Nevada
New Hampshire
New Jersey
New Mexico
New York
North Carolina
North Dakota
Ohio
Oklahoma
Oregon
Pennsylvania
Rhode Island
South Carolina
South Dakota
Tennessee
Texas
Utah
Vermont
Virginia
Washington Source: USPTO Performance
West Virginia and Accountability Report FY
Wisconsin 2013
Wyoming
Puerto Rico
18) Top 25 States Ranked by Patents Granted per Capita (2013)
Patents per 14 Utah 49.41
Rank State
100,000 Inhabitants 15 New York 45.28
1 California 97.67 16 Wisconsin 41.21
2 Massachusetts 96.38 17 Rhode Island 40.05
3 Washington 90.32 18 Illinois 39.61
4 Minnesota 85.24 19 Kansas 37.51
5 Vermont 80.62 20 Arizona 37.08
6 Oregon 66.01 21 Texas 36.18
7 Connecticut 64.57 22 Ohio 35.65
8 New Hampshire 62.59 23 Nevada 34.37
9 Idaho 61.07 24 North Carolina 33.68
10 Colorado 58.67 25 Pennsylvania 32.44
11 New Jersey 55.81
12 Michigan 54.93 Calculated using patent counts for FY 2013 and U.S.
13 Delaware 51.70 Census Bureau Population Estimates 2013
Intellectual Property Owners Association