Page 27 - IP Record
P. 27
The IP Record - 2014 25
USPTO Data
5) Average Patent Pendency Time at 6) Pending Patent Applications at
USPTO USPTO
1,500,000
40.0 Total Pending
1,380,000 Applications
37.5
1,260,000 Awaiting Action
35.0 Pendency Time by Examiner
First Office 1,140,000
32.5 Action
30.0 Applications 1,020,000
Months 27.5 900,000
25.0 780,000
660,000
22.5
Source: WIPO World 540,000
20.0 Intellectual Property
Indicators, 2012, 420,000 Source: USPTO
17.5 USPTO Performance Performance Accountability
and Accountability 300,000 Report FY 2013
Report, FY 2013 2004 2005 2006 2007 2008 2009 2010 2011 2012 2013
15.0
2004 2005 2006 2007 2008 2009 2010 2011 2012 2013
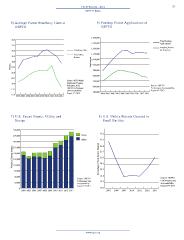
7) U.S. Patent Grants, Utility and 8) U.S. Utility Patents Granted to
Design Small Entities
300,000
22.6
270,000 Design
Utility 22.2
240,000 21.8
Number of Patents Granted 180,000 Percentage of Total Patents Granted 21.4
210,000
21.0
150,000
20.6
120,000
90,000 20.2
60,000 19.8
Source: USPTO Source: USPTO
Performance and 19.4 Performance and
30,000 Accountability Accountability
Report FY 2013 Report FY 2013
0 19.0
2004 2005 2006 2007 2008 2009 2010 2011 2012 2013 2007 2008 2009 2010 2011 2012 2013
www.ipo.org
USPTO Data
5) Average Patent Pendency Time at 6) Pending Patent Applications at
USPTO USPTO
1,500,000
40.0 Total Pending
1,380,000 Applications
37.5
1,260,000 Awaiting Action
35.0 Pendency Time by Examiner
First Office 1,140,000
32.5 Action
30.0 Applications 1,020,000
Months 27.5 900,000
25.0 780,000
660,000
22.5
Source: WIPO World 540,000
20.0 Intellectual Property
Indicators, 2012, 420,000 Source: USPTO
17.5 USPTO Performance Performance Accountability
and Accountability 300,000 Report FY 2013
Report, FY 2013 2004 2005 2006 2007 2008 2009 2010 2011 2012 2013
15.0
2004 2005 2006 2007 2008 2009 2010 2011 2012 2013
7) U.S. Patent Grants, Utility and 8) U.S. Utility Patents Granted to
Design Small Entities
300,000
22.6
270,000 Design
Utility 22.2
240,000 21.8
Number of Patents Granted 180,000 Percentage of Total Patents Granted 21.4
210,000
21.0
150,000
20.6
120,000
90,000 20.2
60,000 19.8
Source: USPTO Source: USPTO
Performance and 19.4 Performance and
30,000 Accountability Accountability
Report FY 2013 Report FY 2013
0 19.0
2004 2005 2006 2007 2008 2009 2010 2011 2012 2013 2007 2008 2009 2010 2011 2012 2013
www.ipo.org