Page 25 - IP Record
P. 25
The IP Record - 2014 23
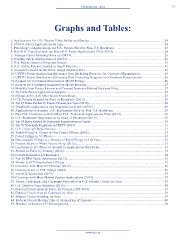
Graphs and Tables:
1. Applications for U.S. Patents Filed, Utility and Design 24
2. USPTO Patent Applications by Type 24
3. Percentage of Applications for U.S. Patents Filed by Non-U.S. Residents 24
4. Non-U.S. Countries with the Most U.S. Patent Applications Filed (2012) 24
5. Average Patent Pendency Time at USPTO 25
6. Pending Patent Applications at USPTO 25
7. U.S. Patent Grants, Utility and Design 25
8. U.S. Utility Patents Granted to Small Entities 25
9. Companies Granted the Most U.S. Design Patents in 2013 26
10. USPTO Patent Application Allowance Rate Including Requests for Continued Examination 26
11. USPTO Patent Application Allowance Rate Excluding Requests for Continued Examination 26
12. Request for Continued Examination (RCE) Filings 26
13. Request for Continued Examination (RCE) Backlog 27
14. Monthly Inter Partes Review and Covered Business Method Petitions Filed 27
15. Ex Parte Patent Application Appeals 27
16. Filings in Pre-AIA After-Grant Proceedings 27
17. U.S. Patents Granted by State of Residence (2013) 28
18. Top 25 States Ranked by Patents Granted per Capita (2013) 28
19. Trademark Applications and Registrations at the USPTO 29
20. Applications to Register U.S. Trademarks Filed by Non-U.S. Residents 29
21. Non-U.S. Countries with the Most U.S. Trademark Applications Filed (2013) 29
22. U.S. Trademark Registrations by State of Residence (2013) 30
23. Top 25 States Ranked by Trademark Registrations per Capita 30
24. Top 50 Trademark Registrants in USPTO (2013) 31
25. U.S. Copyright Registrations 31
26. Patent Filings v. Grants in Five Patent Offices (2012) 32
27. Patent Filings in 5 Offices 32
28. Non-resident Filings as a Percent of Total Filings in 5 Offices 32
29. Percent Share of World Patent Filing (2012) 33
30. Contribution of Offices to Growth in Applications Worldwide 33
31. Patents in Force by Country (2012) 34
32. Patents Examined per Examiner 34
33. Top 50 EPO Patent Applicants (2013) 35
34. Trends in PCT International Filings 35
35. Countries with Most PCT Filings (2013) 36
36. Country Share of PCT Filings (2013) 36
37. Top PCT Applicants (2013) 37
38. Countries with Most Madrid System Applications (2013) 37
39. Patent, Trademark, and Copyright Suits Filed in U.S. District Courts, by Year 38
40. U.S. District Court Statistics (2013) 38
41. Federal Circuit Appeals Filed, by Category (FY 2013) 39
42. Federal Circuit Overall Caseload, by Year 39
43. Federal Circuit Backlog, by Year 39
44. Federal Circuit Median Time to Disposition of Appeals 40
45. Number of Section 337 Investigations 40
www.ipo.org