Page 28 - IP Record
P. 28
26 The IP Record - 2014
USPTO Data
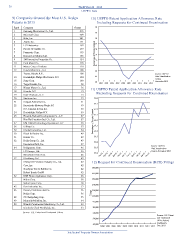
9) Companies Granted the Most U.S. Design 10) USPTO Patent Application Allowance Rate
Patents in 2013 Including Requests for Continued Examination
Rank Company Grants 70
1 Samsung Electronics Co., Ltd. 515
67
2 Microsoft Corp. 409
3 Nike, Inc. 281 64
4 Apple, Inc. 171 61
5 LG Electronics 162
6 Procter & Gamble Co. 159 58
7 Panasonic Corp. 155 Percentage of Patents Granted
8 Research in Motion Ltd. 145 55
9 3M Innovative Properties Co. 134 52
10 Ford Motor Co. 118
11 Masco Corp. of Indiana 110 49
12 Honda Motor Co., Ltd. 108 46
Toyota Jidosha K.K. 108 Source: USPTO
14 Koninklijke Philips Electronics N.V. 104 43 Data Visualization
Center,
15 Sony Corp. 100 40 December 2013
16 Target Brands, Inc. 92 2004 2005 2006 2007 2008 2009 2010 2011 2012 2013
17 Nissan Motor Co., Ltd. 76 11) USPTO Patent Application Allowance Rate
18 Diamler AG 74
Excluding Requests for Continued Examination
19 Otter Products, LLC 73
20 Steelcase Inc. 72 70.0
21 Colgate-Palmolive Co. 71
68.5
22 Bayerische Motoren Werke AG 63
S.C. Johnson & Son Inc. 63 67.0
24 Koninklijke Philips N.V. 59
25 Hewlett-Packard Development Co., L.P. 57 65.5
Hon Hai Precision Ind. Co., Ltd. 57 64.0
27 GM Global Technology Operations LLC 56 Percentage of Patents Granted
28 Gillette Co. 55 62.5
29 Brother Industries, Ltd. 54 61.0
30 Black & Decker Inc. 49
31 Kohler Co. 49 59.5
32 Beifa Group Co., Ltd. 47
58.0
Innovation First, Inc. 47 Source: USPTO
34 Bridgestone Corp. 46 56.5 Data Visualization
LG Hausys, Ltd. 46 Center, December 2013
55.0
Mitsubishi Denki K.K. 46 Oct-08 Apr-09 Oct-09 Apr-10 Oct-10 Apr-11 Oct-11 Apr-12 Oct-12 Apr-13 Oct-13
37 Blackberry Ltd. 42
Cheng Uei Precision Industry Co., Ltd. 42 12) Request for Continued Examination (RCE) Filings
Cree, Inc. 42
180,000
Goodyear Tire & Rubber Co. 42
Robert Bosch GmbH 42 166,000
42 BSH Home Appliances Corp. 38
Nikon Corp. 38 152,000
Seiko Epson Corp. 38
138,000
45 Dart Industries Inc. 37
46 Becton, Dickinson and Co. 36 124,000
Nokia Corp. 36 Filings
48 CJ Cheiljedang Corp. 35 110,000
49 Motorola-Mobility, Inc. 34 96,000
50 Hitachi Construction Machinery Co., Ltd. 33
Kimberly-Clark Worldwide, Inc. 33 82,000
Source: U.S. Patent and Trademark Office 68,000
Source: U.S. Patent
54,000 and Trademark
Office Patents
Dashboard,
40,000
2004 2005 2006 2007 2008 2009 2010 2011 2012 2013 Dec. 2013
Intellectual Property Owners Association
USPTO Data
9) Companies Granted the Most U.S. Design 10) USPTO Patent Application Allowance Rate
Patents in 2013 Including Requests for Continued Examination
Rank Company Grants 70
1 Samsung Electronics Co., Ltd. 515
67
2 Microsoft Corp. 409
3 Nike, Inc. 281 64
4 Apple, Inc. 171 61
5 LG Electronics 162
6 Procter & Gamble Co. 159 58
7 Panasonic Corp. 155 Percentage of Patents Granted
8 Research in Motion Ltd. 145 55
9 3M Innovative Properties Co. 134 52
10 Ford Motor Co. 118
11 Masco Corp. of Indiana 110 49
12 Honda Motor Co., Ltd. 108 46
Toyota Jidosha K.K. 108 Source: USPTO
14 Koninklijke Philips Electronics N.V. 104 43 Data Visualization
Center,
15 Sony Corp. 100 40 December 2013
16 Target Brands, Inc. 92 2004 2005 2006 2007 2008 2009 2010 2011 2012 2013
17 Nissan Motor Co., Ltd. 76 11) USPTO Patent Application Allowance Rate
18 Diamler AG 74
Excluding Requests for Continued Examination
19 Otter Products, LLC 73
20 Steelcase Inc. 72 70.0
21 Colgate-Palmolive Co. 71
68.5
22 Bayerische Motoren Werke AG 63
S.C. Johnson & Son Inc. 63 67.0
24 Koninklijke Philips N.V. 59
25 Hewlett-Packard Development Co., L.P. 57 65.5
Hon Hai Precision Ind. Co., Ltd. 57 64.0
27 GM Global Technology Operations LLC 56 Percentage of Patents Granted
28 Gillette Co. 55 62.5
29 Brother Industries, Ltd. 54 61.0
30 Black & Decker Inc. 49
31 Kohler Co. 49 59.5
32 Beifa Group Co., Ltd. 47
58.0
Innovation First, Inc. 47 Source: USPTO
34 Bridgestone Corp. 46 56.5 Data Visualization
LG Hausys, Ltd. 46 Center, December 2013
55.0
Mitsubishi Denki K.K. 46 Oct-08 Apr-09 Oct-09 Apr-10 Oct-10 Apr-11 Oct-11 Apr-12 Oct-12 Apr-13 Oct-13
37 Blackberry Ltd. 42
Cheng Uei Precision Industry Co., Ltd. 42 12) Request for Continued Examination (RCE) Filings
Cree, Inc. 42
180,000
Goodyear Tire & Rubber Co. 42
Robert Bosch GmbH 42 166,000
42 BSH Home Appliances Corp. 38
Nikon Corp. 38 152,000
Seiko Epson Corp. 38
138,000
45 Dart Industries Inc. 37
46 Becton, Dickinson and Co. 36 124,000
Nokia Corp. 36 Filings
48 CJ Cheiljedang Corp. 35 110,000
49 Motorola-Mobility, Inc. 34 96,000
50 Hitachi Construction Machinery Co., Ltd. 33
Kimberly-Clark Worldwide, Inc. 33 82,000
Source: U.S. Patent and Trademark Office 68,000
Source: U.S. Patent
54,000 and Trademark
Office Patents
Dashboard,
40,000
2004 2005 2006 2007 2008 2009 2010 2011 2012 2013 Dec. 2013
Intellectual Property Owners Association