Page 31 - IP Record
P. 31
The IP Record - 2014 29
USPTO Data
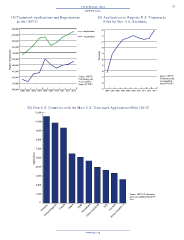
19) Trademark Applications and Registrations 20) Applications to Register U.S. Trademarks
at the USPTO Filed by Non-U.S. Residents
450,000 23
Applications
415,000 22
Registrations
380,000 21
345,000 20
Number of Trademarks 275,000 Percentage 19
310,000
18
240,000
17
205,000 16
170,000 Source: USPTO 15 Source: USPTO
Performance and Performance and
Accountability Accountability
135,000 Report FY 2013 14 Report FY 2013
100,000 13
2004 2005 2006 2007 2008 2009 2010 2011 2012 2013 2004 2005 2006 2007 2008 2009 2010 2011 2012 2013
21) Non-U.S. Countries with the Most U.S. Trademark Applications Filed (2013)
12,000
10,800
9,600
8,400
7,200
Applications 6,000
4,800
3,600
2,400
1,200 Source: USPTO Performance
and Accountability Report FY
2013
0
Korea, Republic of
United Kingdom
China (mainland)
Germany Canada France Japan Switzerland Italy Australia
www.ipo.org
USPTO Data
19) Trademark Applications and Registrations 20) Applications to Register U.S. Trademarks
at the USPTO Filed by Non-U.S. Residents
450,000 23
Applications
415,000 22
Registrations
380,000 21
345,000 20
Number of Trademarks 275,000 Percentage 19
310,000
18
240,000
17
205,000 16
170,000 Source: USPTO 15 Source: USPTO
Performance and Performance and
Accountability Accountability
135,000 Report FY 2013 14 Report FY 2013
100,000 13
2004 2005 2006 2007 2008 2009 2010 2011 2012 2013 2004 2005 2006 2007 2008 2009 2010 2011 2012 2013
21) Non-U.S. Countries with the Most U.S. Trademark Applications Filed (2013)
12,000
10,800
9,600
8,400
7,200
Applications 6,000
4,800
3,600
2,400
1,200 Source: USPTO Performance
and Accountability Report FY
2013
0
Korea, Republic of
United Kingdom
China (mainland)
Germany Canada France Japan Switzerland Italy Australia
www.ipo.org