Page 26 - IP Record
P. 26
24 The IP Record - 2014
USPTO Data
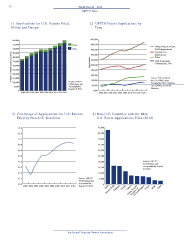
1) Applications for U.S. Patents Filed, 2) USPTO Patent Applications by
Utility and Design Type
600,000 600,000
550,000 Design 540,100
Utility, Plant, & Reissue
500,000 Utility 480,200 (UPR) Applications
Original UPR
Number of Patent Applications Filed 350,000 Applications 360,400 Total Divisionals,
450,000
Applications
420,300
RCEs
400,000
Continuations, CIPs
300,500
300,000
250,000
240,600
200,000
150,000
120,800
No. F-14-00116 data.
100,000 Source: USPTO 180,700 Source: FOIA Request
Provided by Chris Cotropia,
Performance and
50,000 Accountability 60,900 Cecil Quillen, and Slim
Report FY 2013 Webester.
0 1,000
2004 2005 2006 2007 2008 2009 2010 2011 2012 2013 2004 2005 2006 2007 2008 2009 2010 2011 2012 2013
3) Percentage of Applications for U.S. Patents 4) Non-U.S. Countries with the Most
Filed by Non-U.S. Residents U.S. Patent Applications Filed (2012)
54.0 95,000
52.6 85,500
51.2 76,000
49.8 66,500
48.4 57,000
47.0 47,500
45.6 38,000 Source: USPTO
Performance and
44.2 28,500 Accountability Report
FY 2013
42.8 19,000
41.4 Source: USPTO 9,500
Performance and
40.0 Accountability 0
China, People's
United Kingdom
2003 2004 2005 2006 2007 2008 2009 2010 2011 2012 Report FY 2013 Japan Korea, South Germany Taiwan Canada Republic of France Israel India
Intellectual Property Owners Association
USPTO Data
1) Applications for U.S. Patents Filed, 2) USPTO Patent Applications by
Utility and Design Type
600,000 600,000
550,000 Design 540,100
Utility, Plant, & Reissue
500,000 Utility 480,200 (UPR) Applications
Original UPR
Number of Patent Applications Filed 350,000 Applications 360,400 Total Divisionals,
450,000
Applications
420,300
RCEs
400,000
Continuations, CIPs
300,500
300,000
250,000
240,600
200,000
150,000
120,800
No. F-14-00116 data.
100,000 Source: USPTO 180,700 Source: FOIA Request
Provided by Chris Cotropia,
Performance and
50,000 Accountability 60,900 Cecil Quillen, and Slim
Report FY 2013 Webester.
0 1,000
2004 2005 2006 2007 2008 2009 2010 2011 2012 2013 2004 2005 2006 2007 2008 2009 2010 2011 2012 2013
3) Percentage of Applications for U.S. Patents 4) Non-U.S. Countries with the Most
Filed by Non-U.S. Residents U.S. Patent Applications Filed (2012)
54.0 95,000
52.6 85,500
51.2 76,000
49.8 66,500
48.4 57,000
47.0 47,500
45.6 38,000 Source: USPTO
Performance and
44.2 28,500 Accountability Report
FY 2013
42.8 19,000
41.4 Source: USPTO 9,500
Performance and
40.0 Accountability 0
China, People's
United Kingdom
2003 2004 2005 2006 2007 2008 2009 2010 2011 2012 Report FY 2013 Japan Korea, South Germany Taiwan Canada Republic of France Israel India
Intellectual Property Owners Association