Page 37 - IP Record
P. 37
The IP Record - 2014 35
International Data
33) Top 50 EPO Patent Applicants (2013)
Rank Company Applications 26 ZTE 616
1 Samsung 2,833 27 ABB 602
2 Siemens 1,974 28 Microsoft Corporation 599
3 Philips 1,839 29 Hoffmann-La Roche 594
4 LG 1,648 30 3M Company 569
5 BASF 1,577 31 Dow Chemical Company 560
6 Robert Bosch 1,574 32 BSH 559
7 Mitsubishi 1,327 33 Commissariat a L’Energie Atomique 546
8 General Electric 1,257 34 Blackberry Limited 525
9 Qualcomm 1,204 35 Technicolor 520
10 Ericsson 1,184 36 Honeywell 519
11 Huawei 1,077 37 Procter & Gamble Company 516
12 Panasonic 1,055 38 United Technologies 507
13 Toyota Motor 894 39 Boeing 501
14 Hitachi 874 40 Toshiba 489
15 Sony 855 41 Alstom SA 464
16 Bayer 850 42 Unilever 456
17 Alcatel Lucent 806 43 Nestle 435
18 EADS 783 44 Merck KGAA 418
19 Nokia 761 45 Dupont 400
20 Fujitsu 722 46 Fraunhofer-Gesellschaft 400
21 NEC 699 47 Continental AG 392
22 Canon 682 48 Intel 381
23 DSM N.V. 659 49 Novartis 376
24 Johnson & Johnson 659 50 Google 368
25 Sanof 651 50 Ricoh 368
Source: EPO Statistics Webpage, April 2014
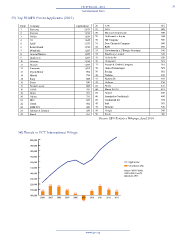
34) Trends in PCT International Filings
200,000
190,000
180,000
170,000
160,000 Applications
Growth Rate (%)
150,000
Source: WIPO World
140,000 Intellectual Property
Indicators, 2013
130,000
120,000 11.5 11
9.4
7.1
110,000 6.4 6.9 5.7 4.9
2.1
100,000
2004 2005 2006 2007 2008 2009 2010 2011 2012 2013
-4.8
www.ipo.org
International Data
33) Top 50 EPO Patent Applicants (2013)
Rank Company Applications 26 ZTE 616
1 Samsung 2,833 27 ABB 602
2 Siemens 1,974 28 Microsoft Corporation 599
3 Philips 1,839 29 Hoffmann-La Roche 594
4 LG 1,648 30 3M Company 569
5 BASF 1,577 31 Dow Chemical Company 560
6 Robert Bosch 1,574 32 BSH 559
7 Mitsubishi 1,327 33 Commissariat a L’Energie Atomique 546
8 General Electric 1,257 34 Blackberry Limited 525
9 Qualcomm 1,204 35 Technicolor 520
10 Ericsson 1,184 36 Honeywell 519
11 Huawei 1,077 37 Procter & Gamble Company 516
12 Panasonic 1,055 38 United Technologies 507
13 Toyota Motor 894 39 Boeing 501
14 Hitachi 874 40 Toshiba 489
15 Sony 855 41 Alstom SA 464
16 Bayer 850 42 Unilever 456
17 Alcatel Lucent 806 43 Nestle 435
18 EADS 783 44 Merck KGAA 418
19 Nokia 761 45 Dupont 400
20 Fujitsu 722 46 Fraunhofer-Gesellschaft 400
21 NEC 699 47 Continental AG 392
22 Canon 682 48 Intel 381
23 DSM N.V. 659 49 Novartis 376
24 Johnson & Johnson 659 50 Google 368
25 Sanof 651 50 Ricoh 368
Source: EPO Statistics Webpage, April 2014
34) Trends in PCT International Filings
200,000
190,000
180,000
170,000
160,000 Applications
Growth Rate (%)
150,000
Source: WIPO World
140,000 Intellectual Property
Indicators, 2013
130,000
120,000 11.5 11
9.4
7.1
110,000 6.4 6.9 5.7 4.9
2.1
100,000
2004 2005 2006 2007 2008 2009 2010 2011 2012 2013
-4.8
www.ipo.org